🇬🇧 Enable Xdebug in DDEV and configure PhpStorm (Full Guide)
in / Technology and Innovation on Drupal, Phpstorm, Xdebug

Requirements
To follow this guide, you must have:
- A local Drupal project running inside DDEV
- PhpStorm installed
1. Activate Xdebug in DDEV
ddev xdebug enable
Expected output:
Enabled xdebug
Verify it loaded:
ddev exec php -m | grep -i xdebug
ddev exec php -i | grep -E "xdebug.mode|start_with_request|client_host|client_port"
You should see:
xdebug.mode => debug,develop
xdebug.client_host => host.docker.internal
xdebug.client_port => 9003
2. Configure PhpStorm (one time per project)
A) Define Server + Path Mappings
Settings → PHP → Servers → (+)
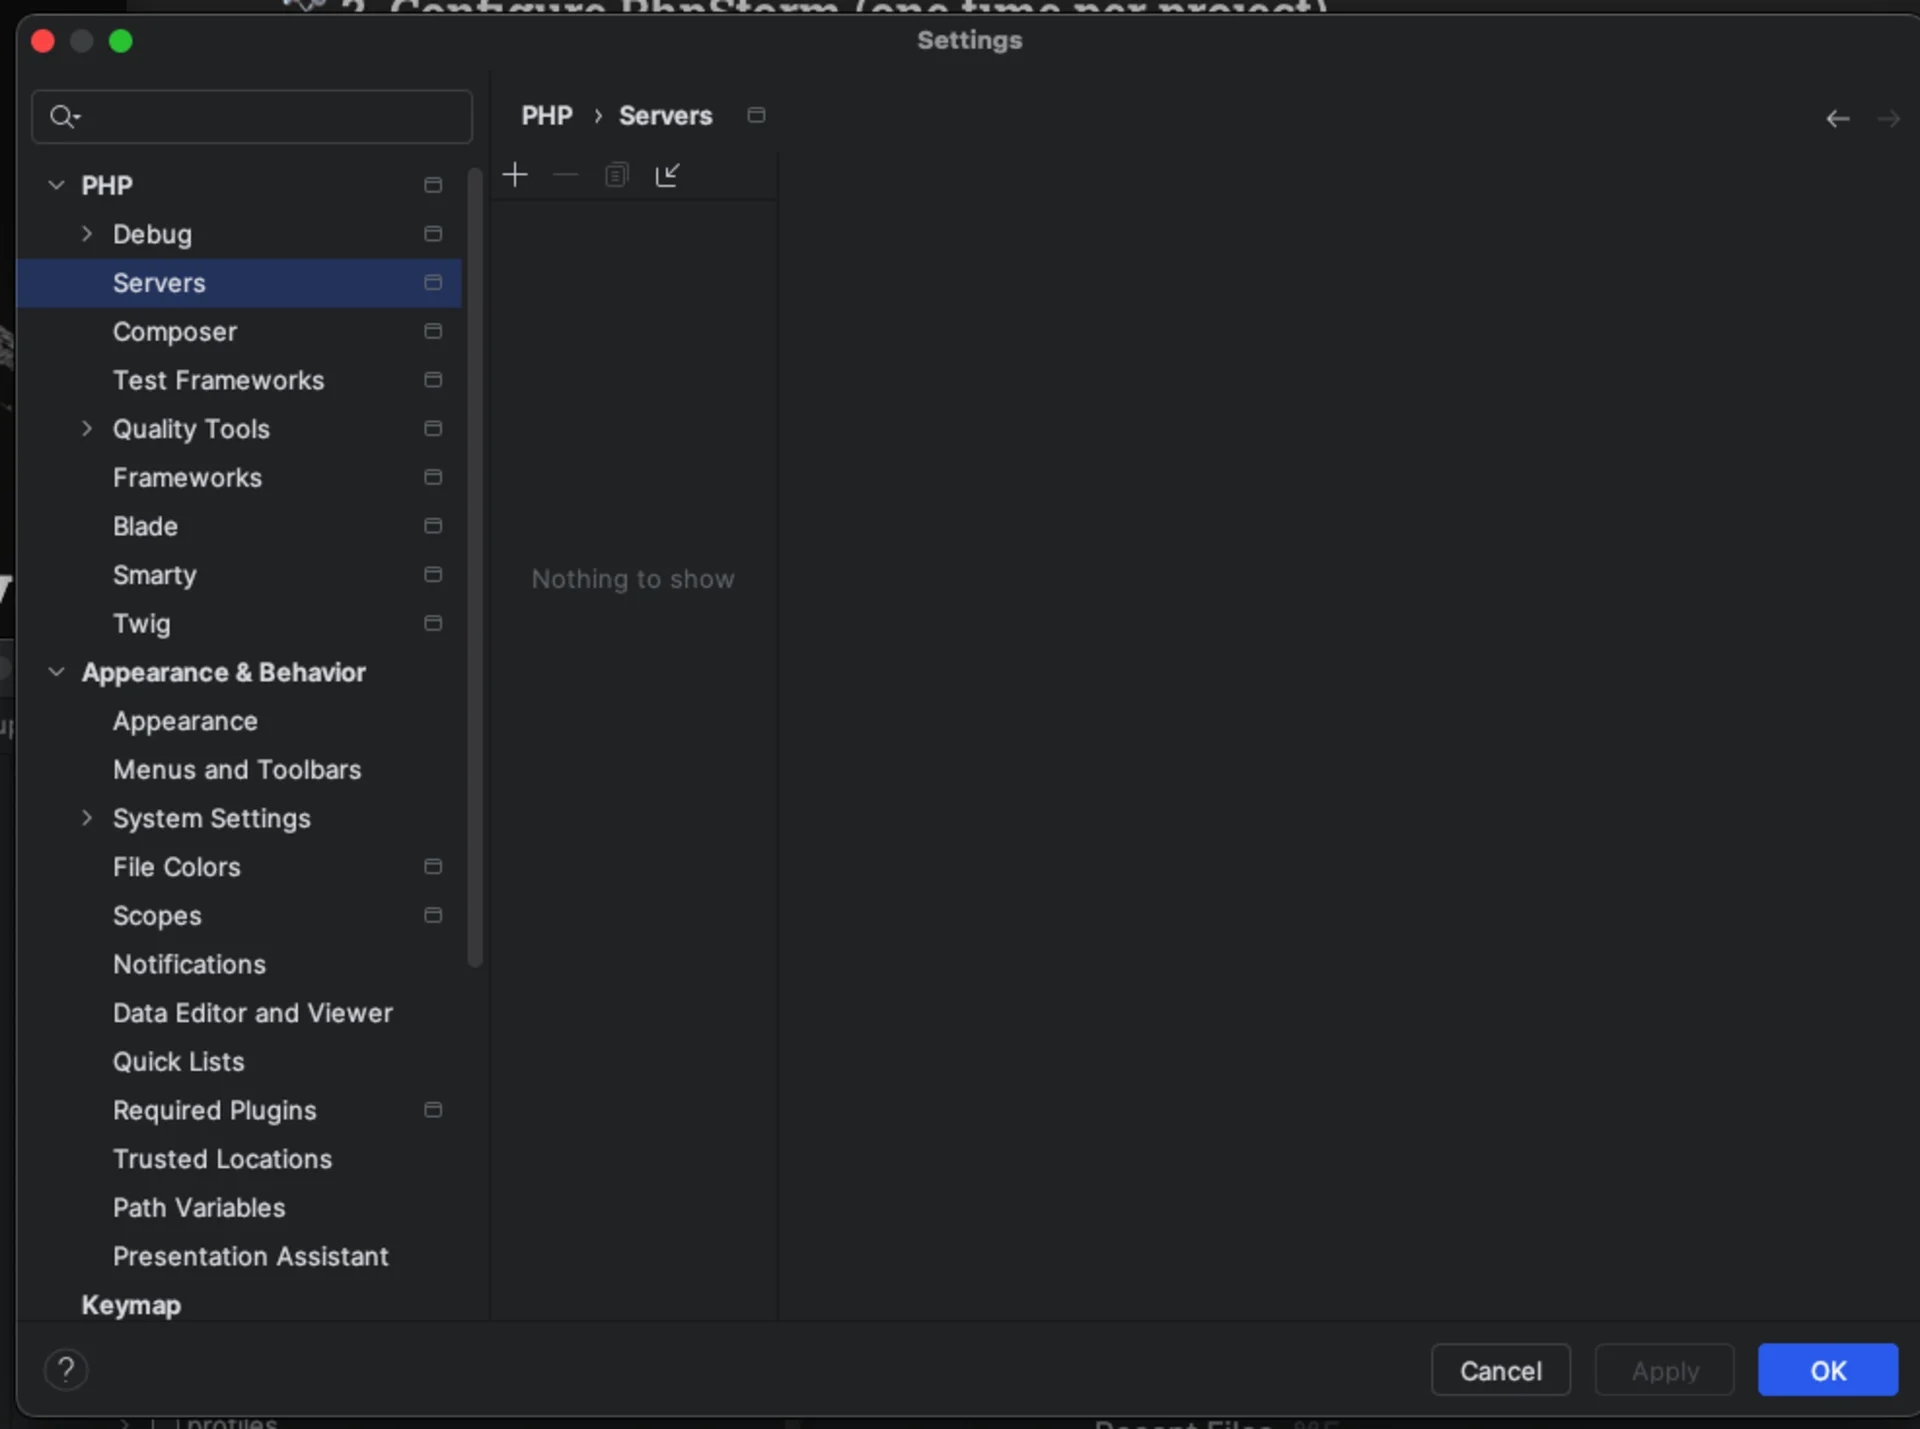
Use your local domain:
- Name: local
- Host: drupal-init.ddev.site
- Port: 80 (or 443 if using HTTPS)
- Debugger: Xdebug
- Use path mappings: ✔️
Map like this:
/Users/user/Desktop/Projects/drupal/web → /var/www/html/web
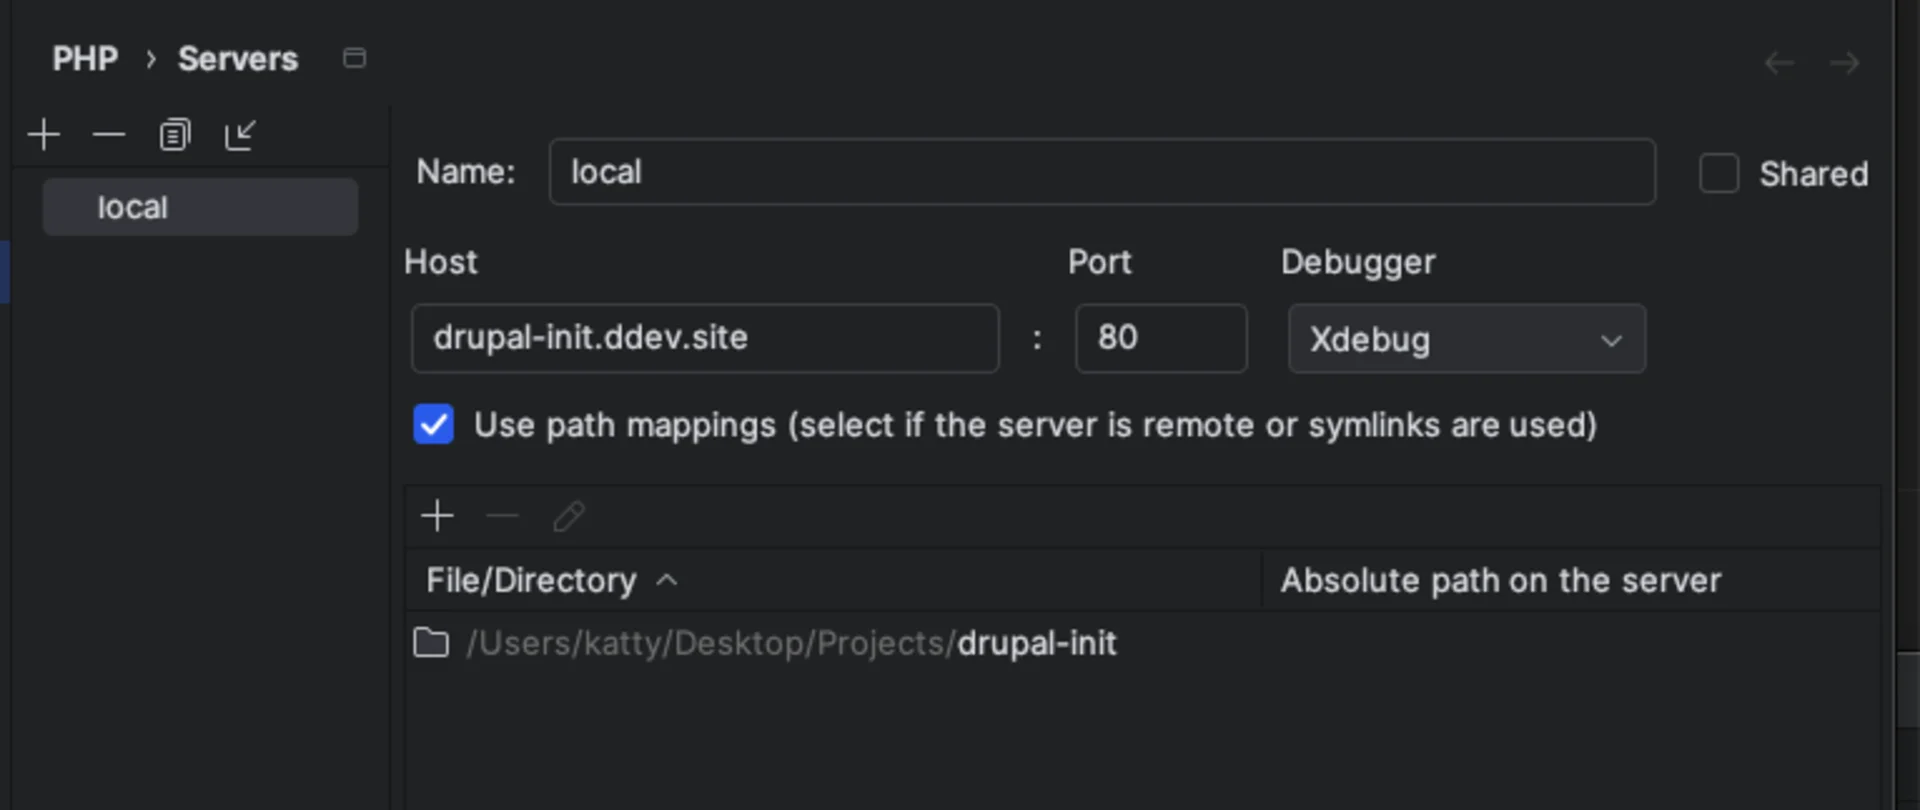
This is crucial because inside DDEV, Drupal lives in /var/www/html/web.
B) Debug Preferences
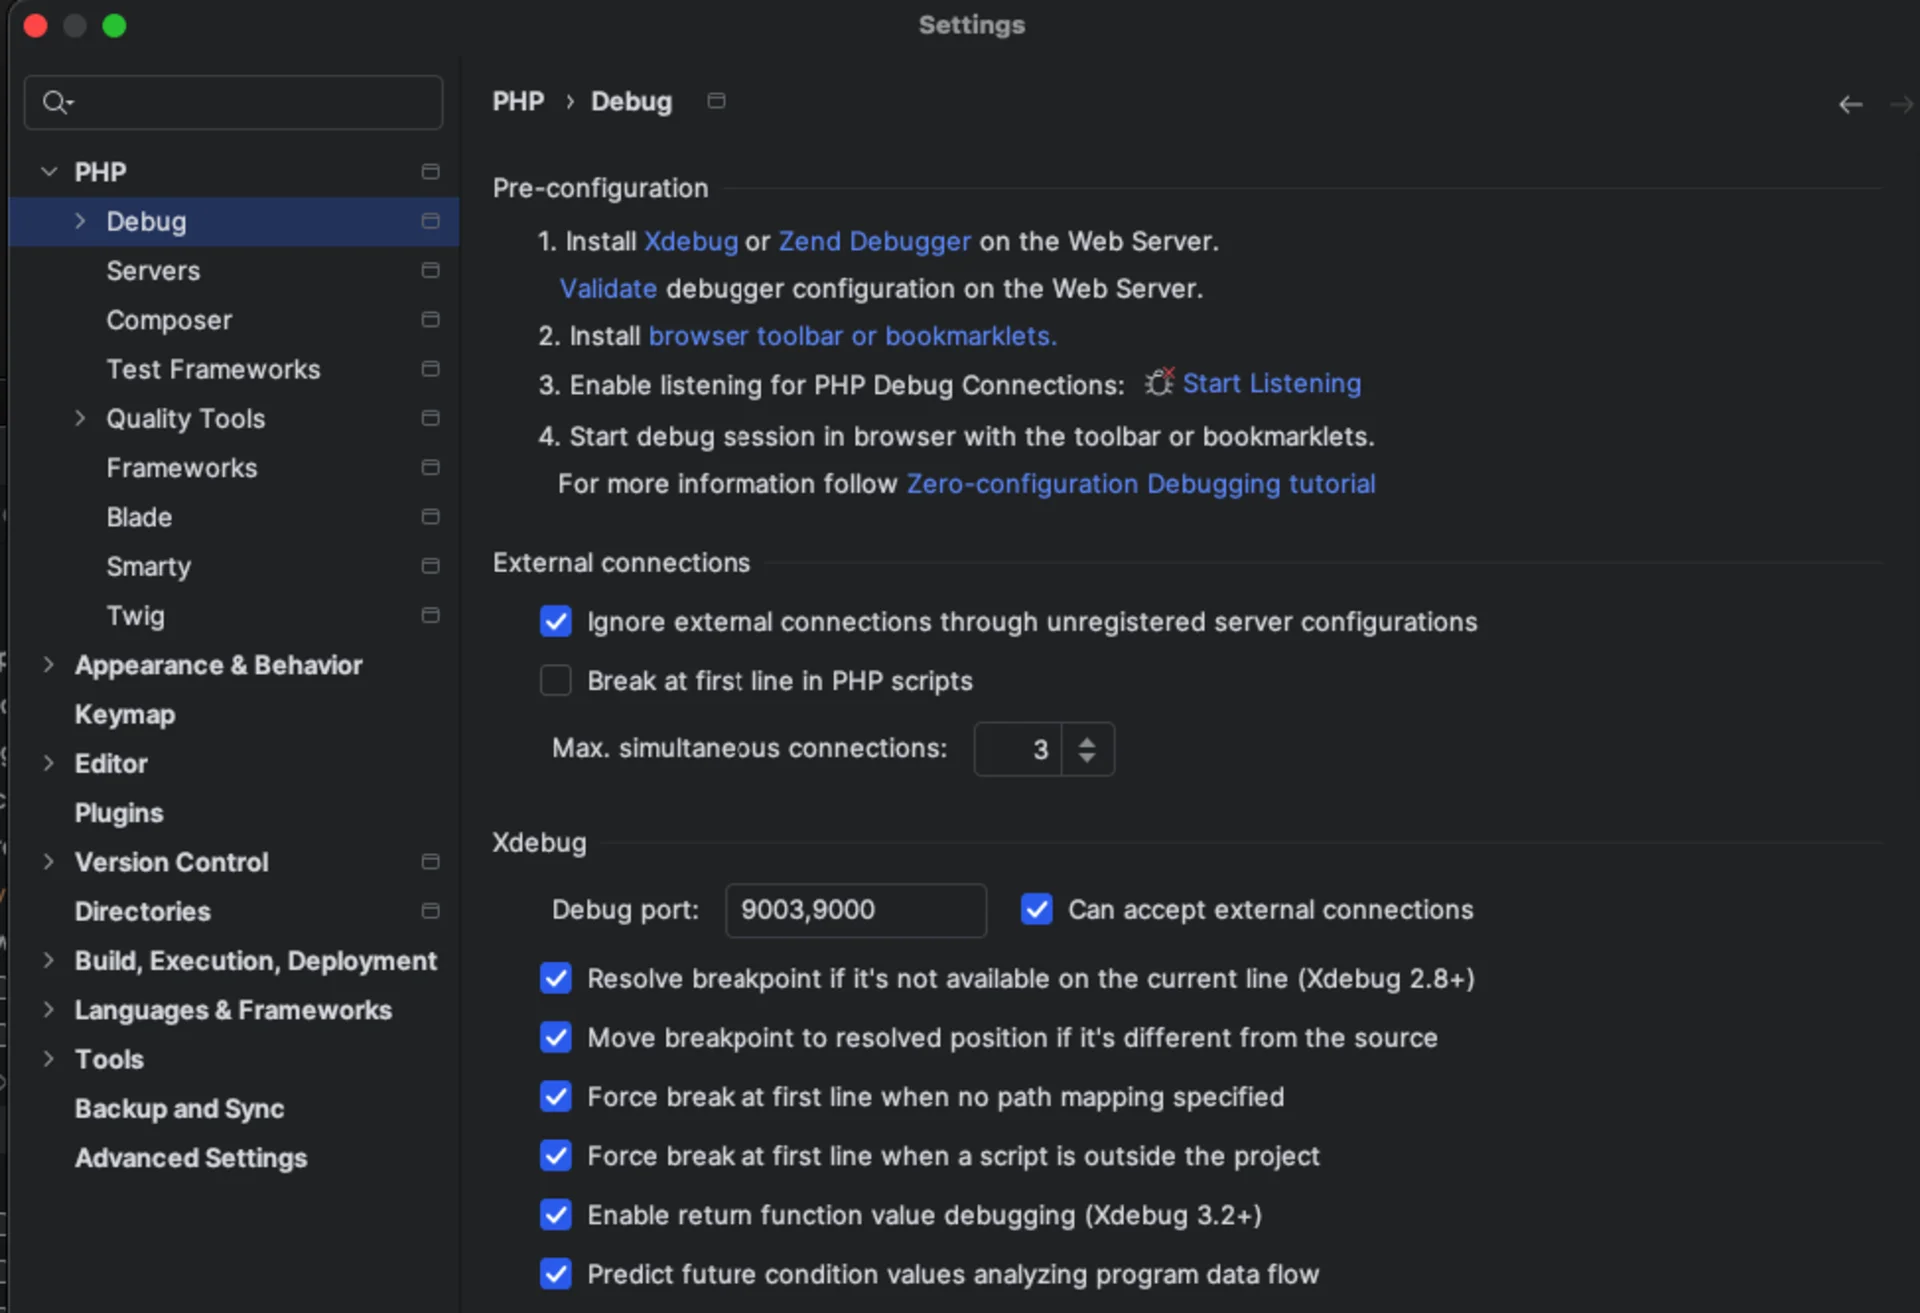
Settings → PHP → Debug
Recommended:
- Disable: Break at first line
- Xdebug port:
9003
3. Install Chrome Extension (optional but powerful)
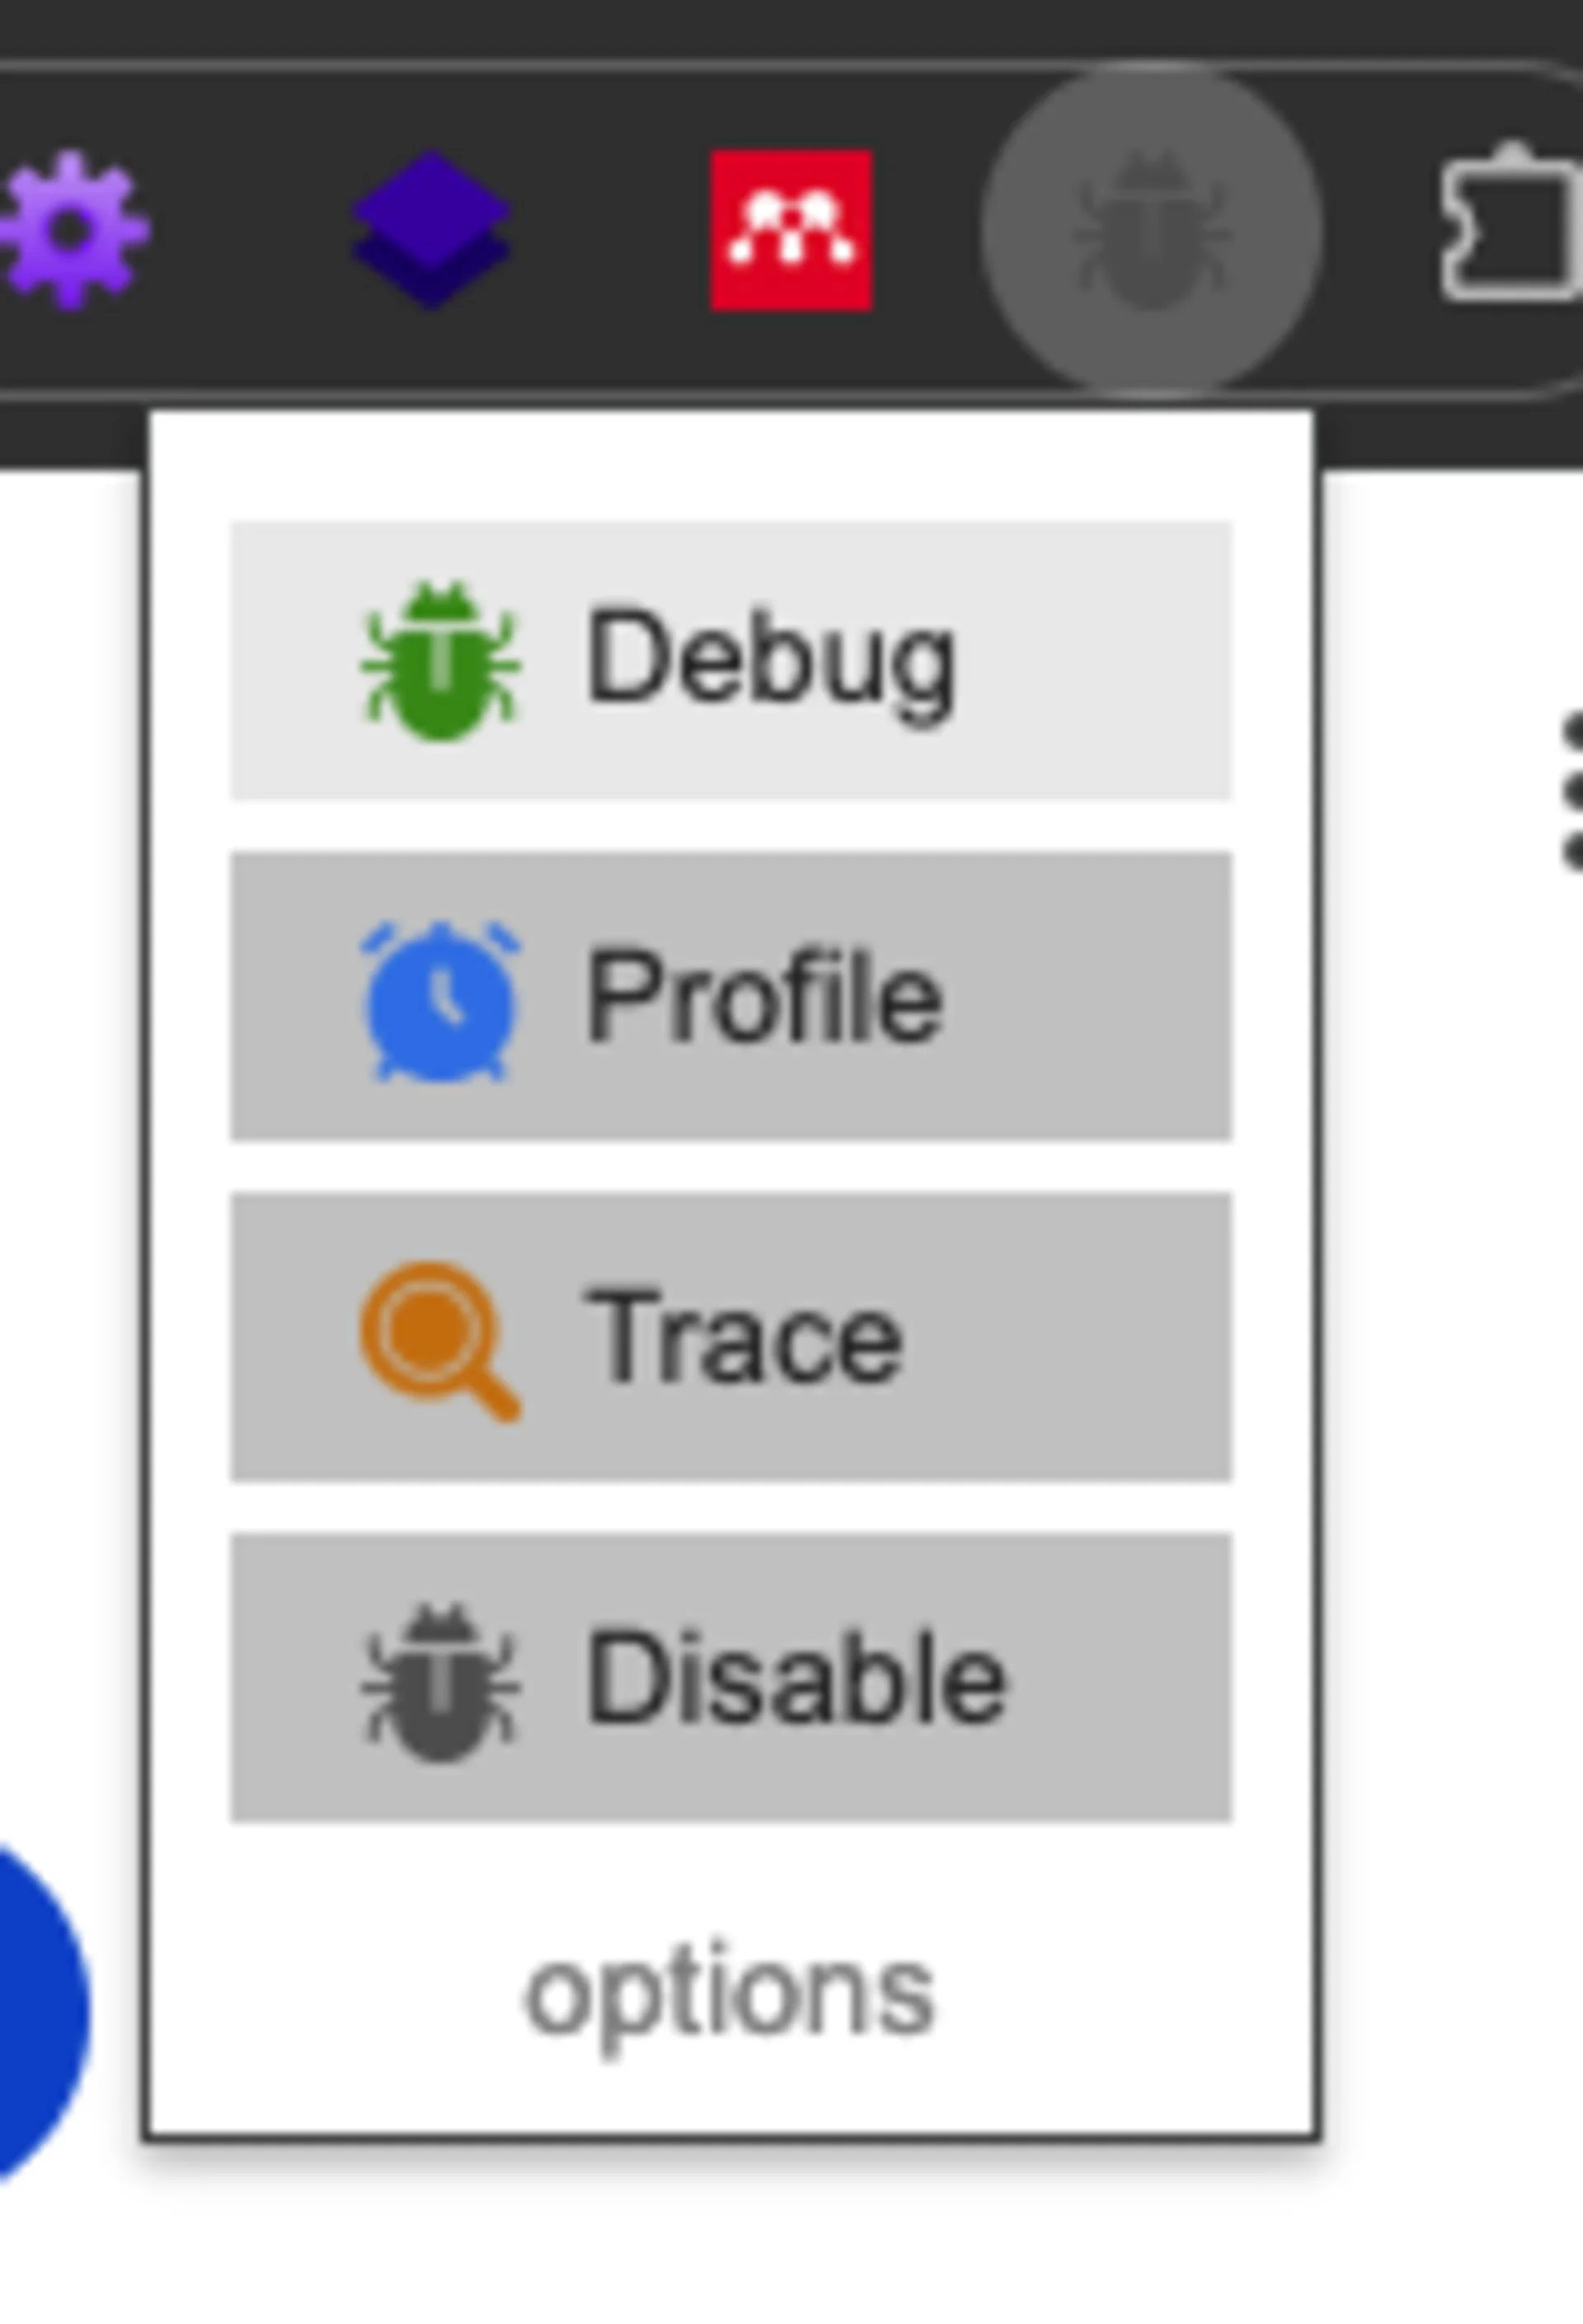
- Install Xdebug Helper https://chromewebstore.google.com/detail/xdebug-helper-by-jetbrain/aoelhdemabeimdhedkidlnbkfhnhgnhm
- Enable the extension
- Select DEBUG mode
- Reload the browser page you want to debug
4. Start Debugging
In PhpStorm:
- Click “Start Listening for PHP Debug Connections” (green phone icon)
- Place a breakpoint Example: inside a custom block’s
build()method - Refresh the browser page

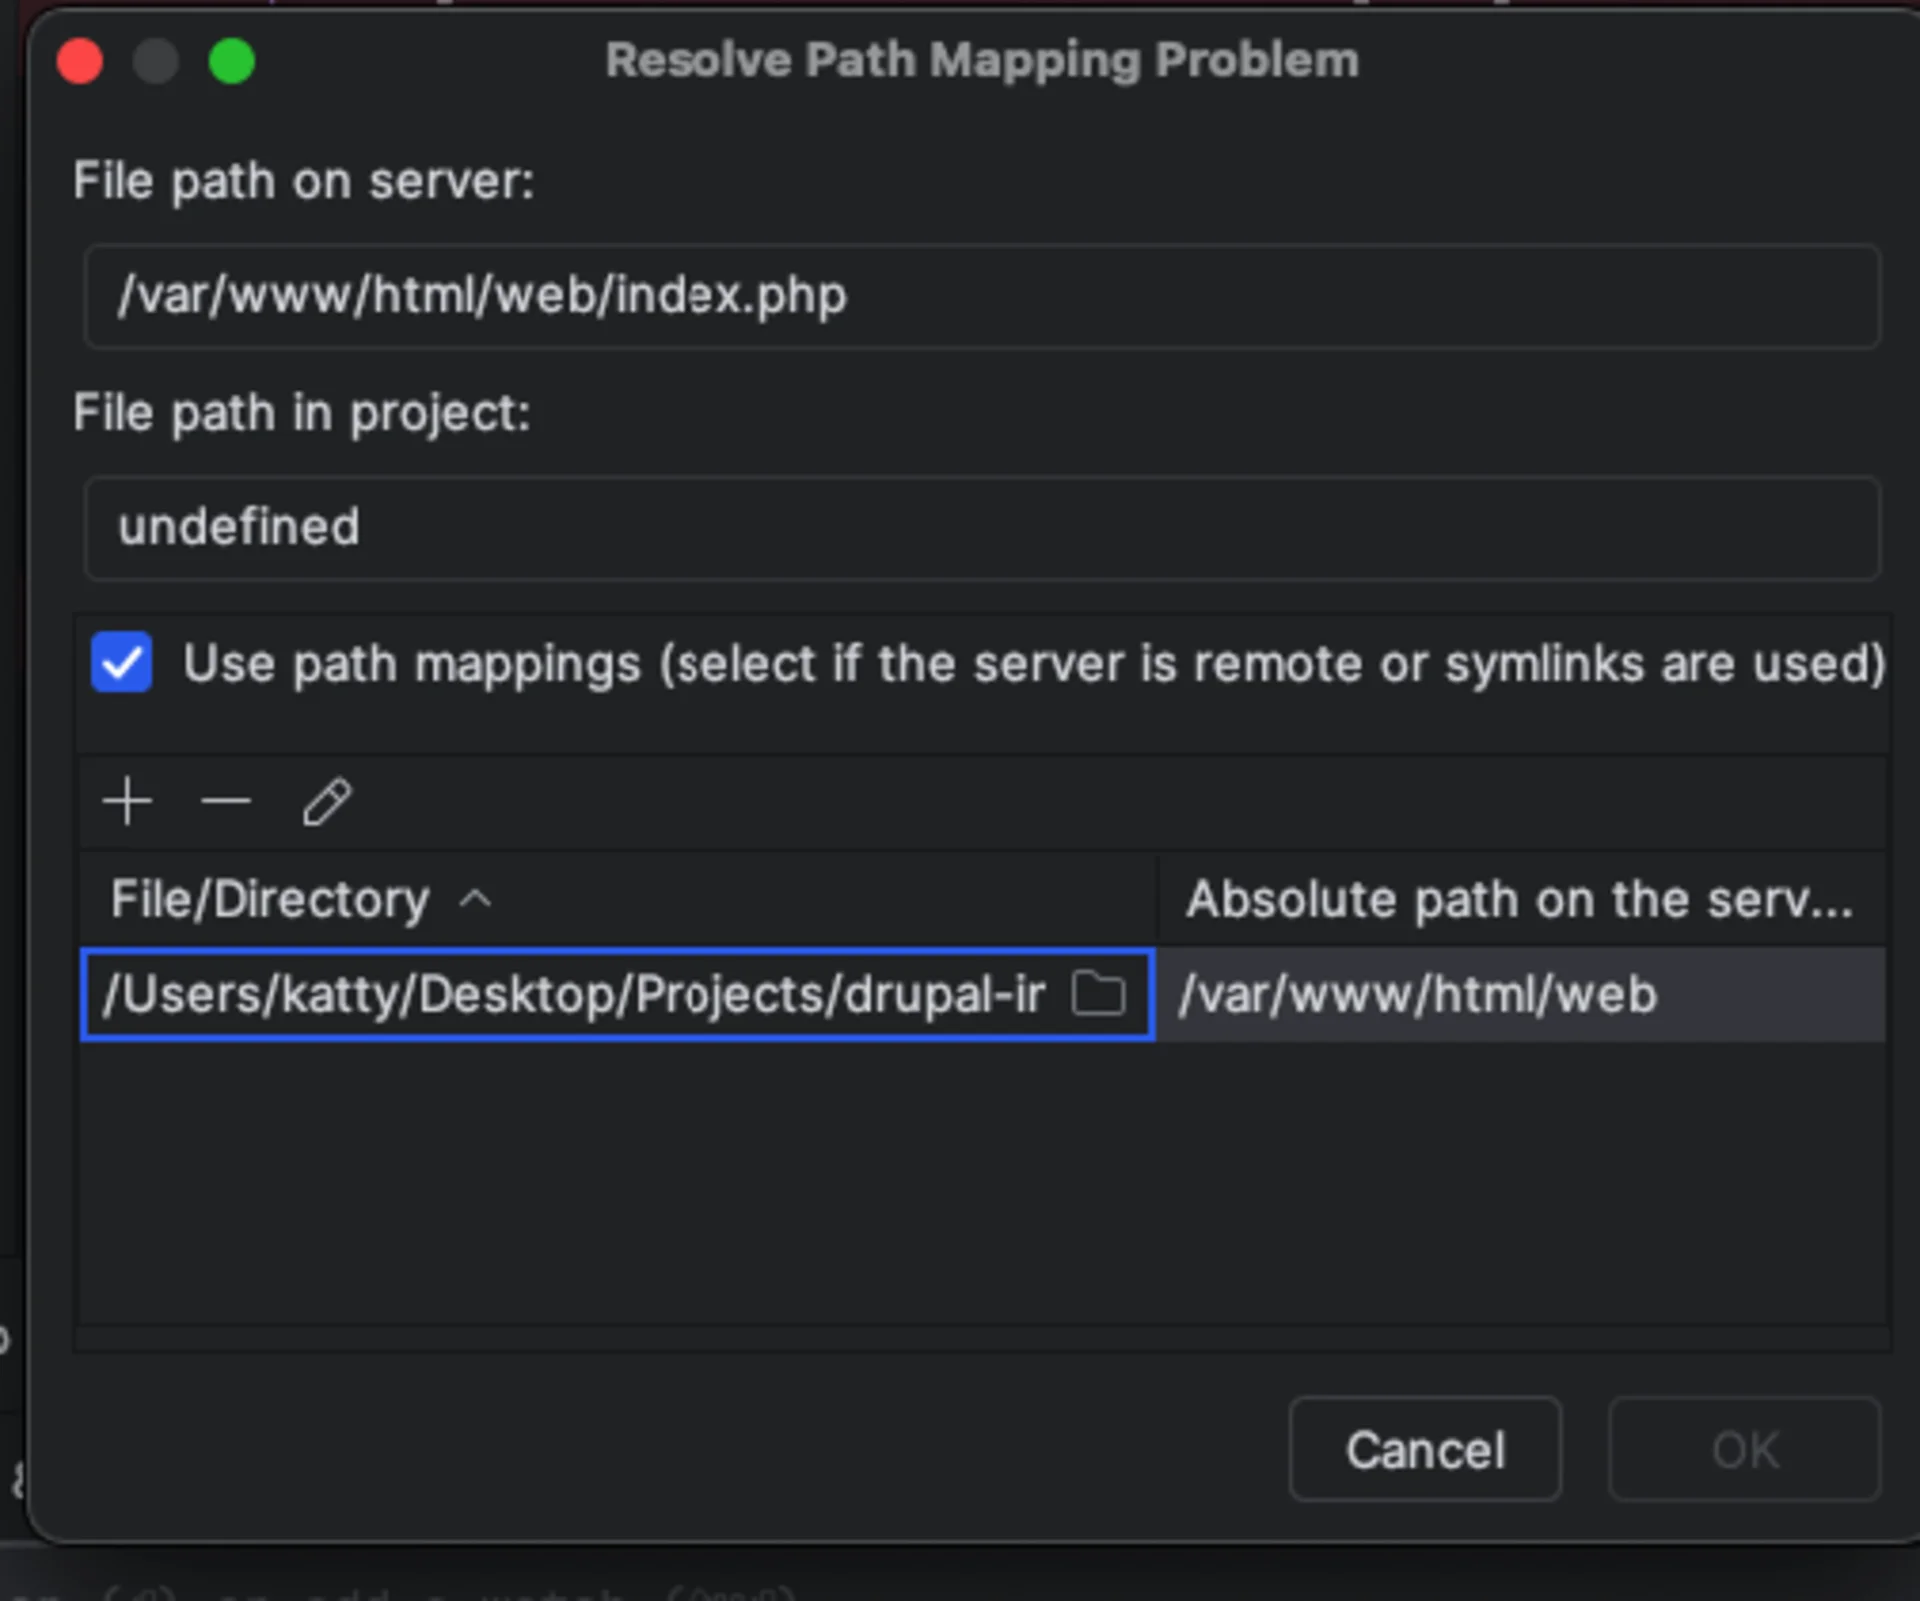
Common Error: Path Mapping Popup
When debugging for the first time, you may see:
Remote file path "/var/www/html/web/index.php"
is not mapped to any file in project.
File path in project: undefined

Solution
Set the correct mapping:
File/Directory (local):
/Users/katty/Desktop/Projects/drupal-init/web
Absolute path on the server:
/var/www/html/web
Save and click OK.
After this, debugging should work immediately.
Authored by Eduardo Telaya.
